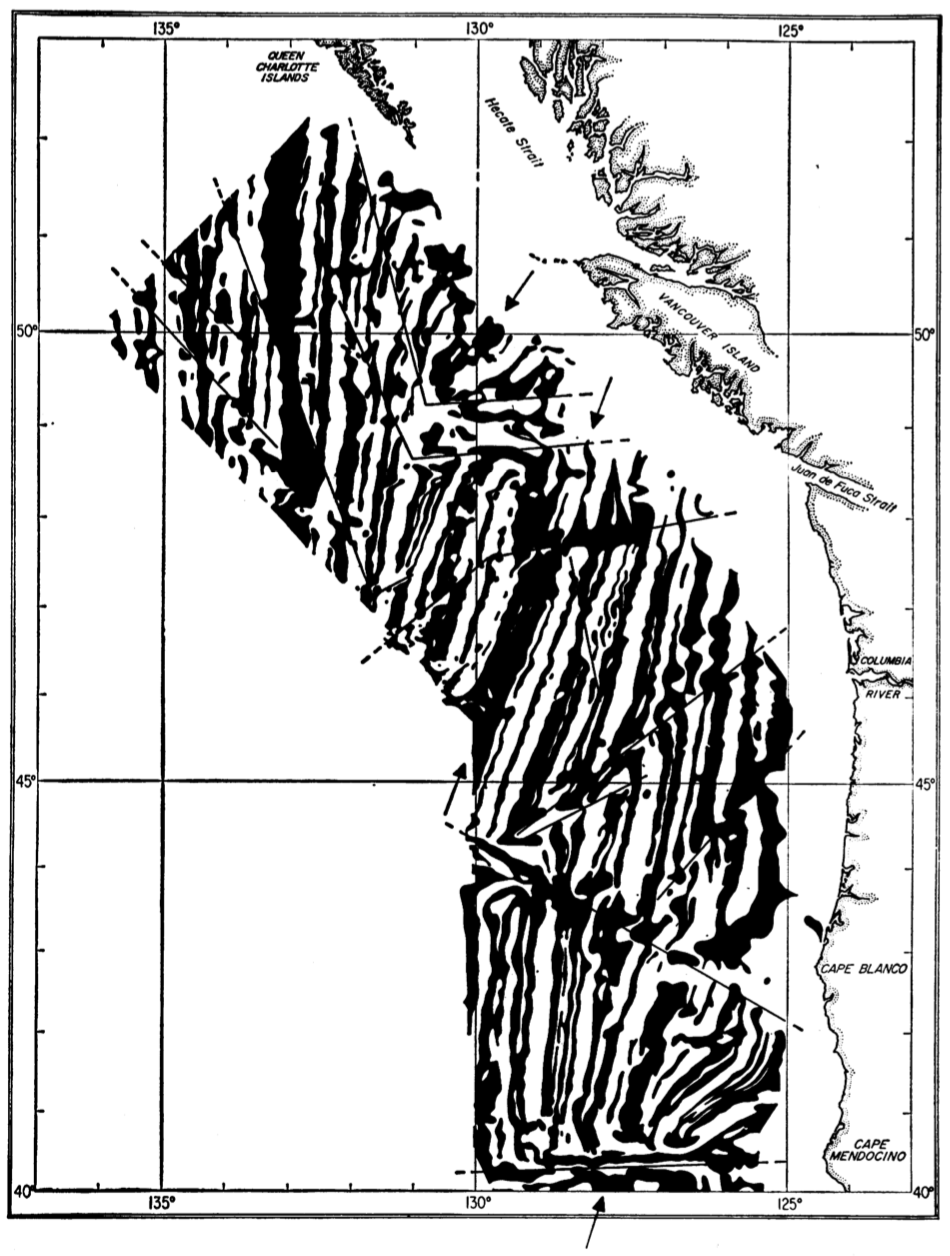
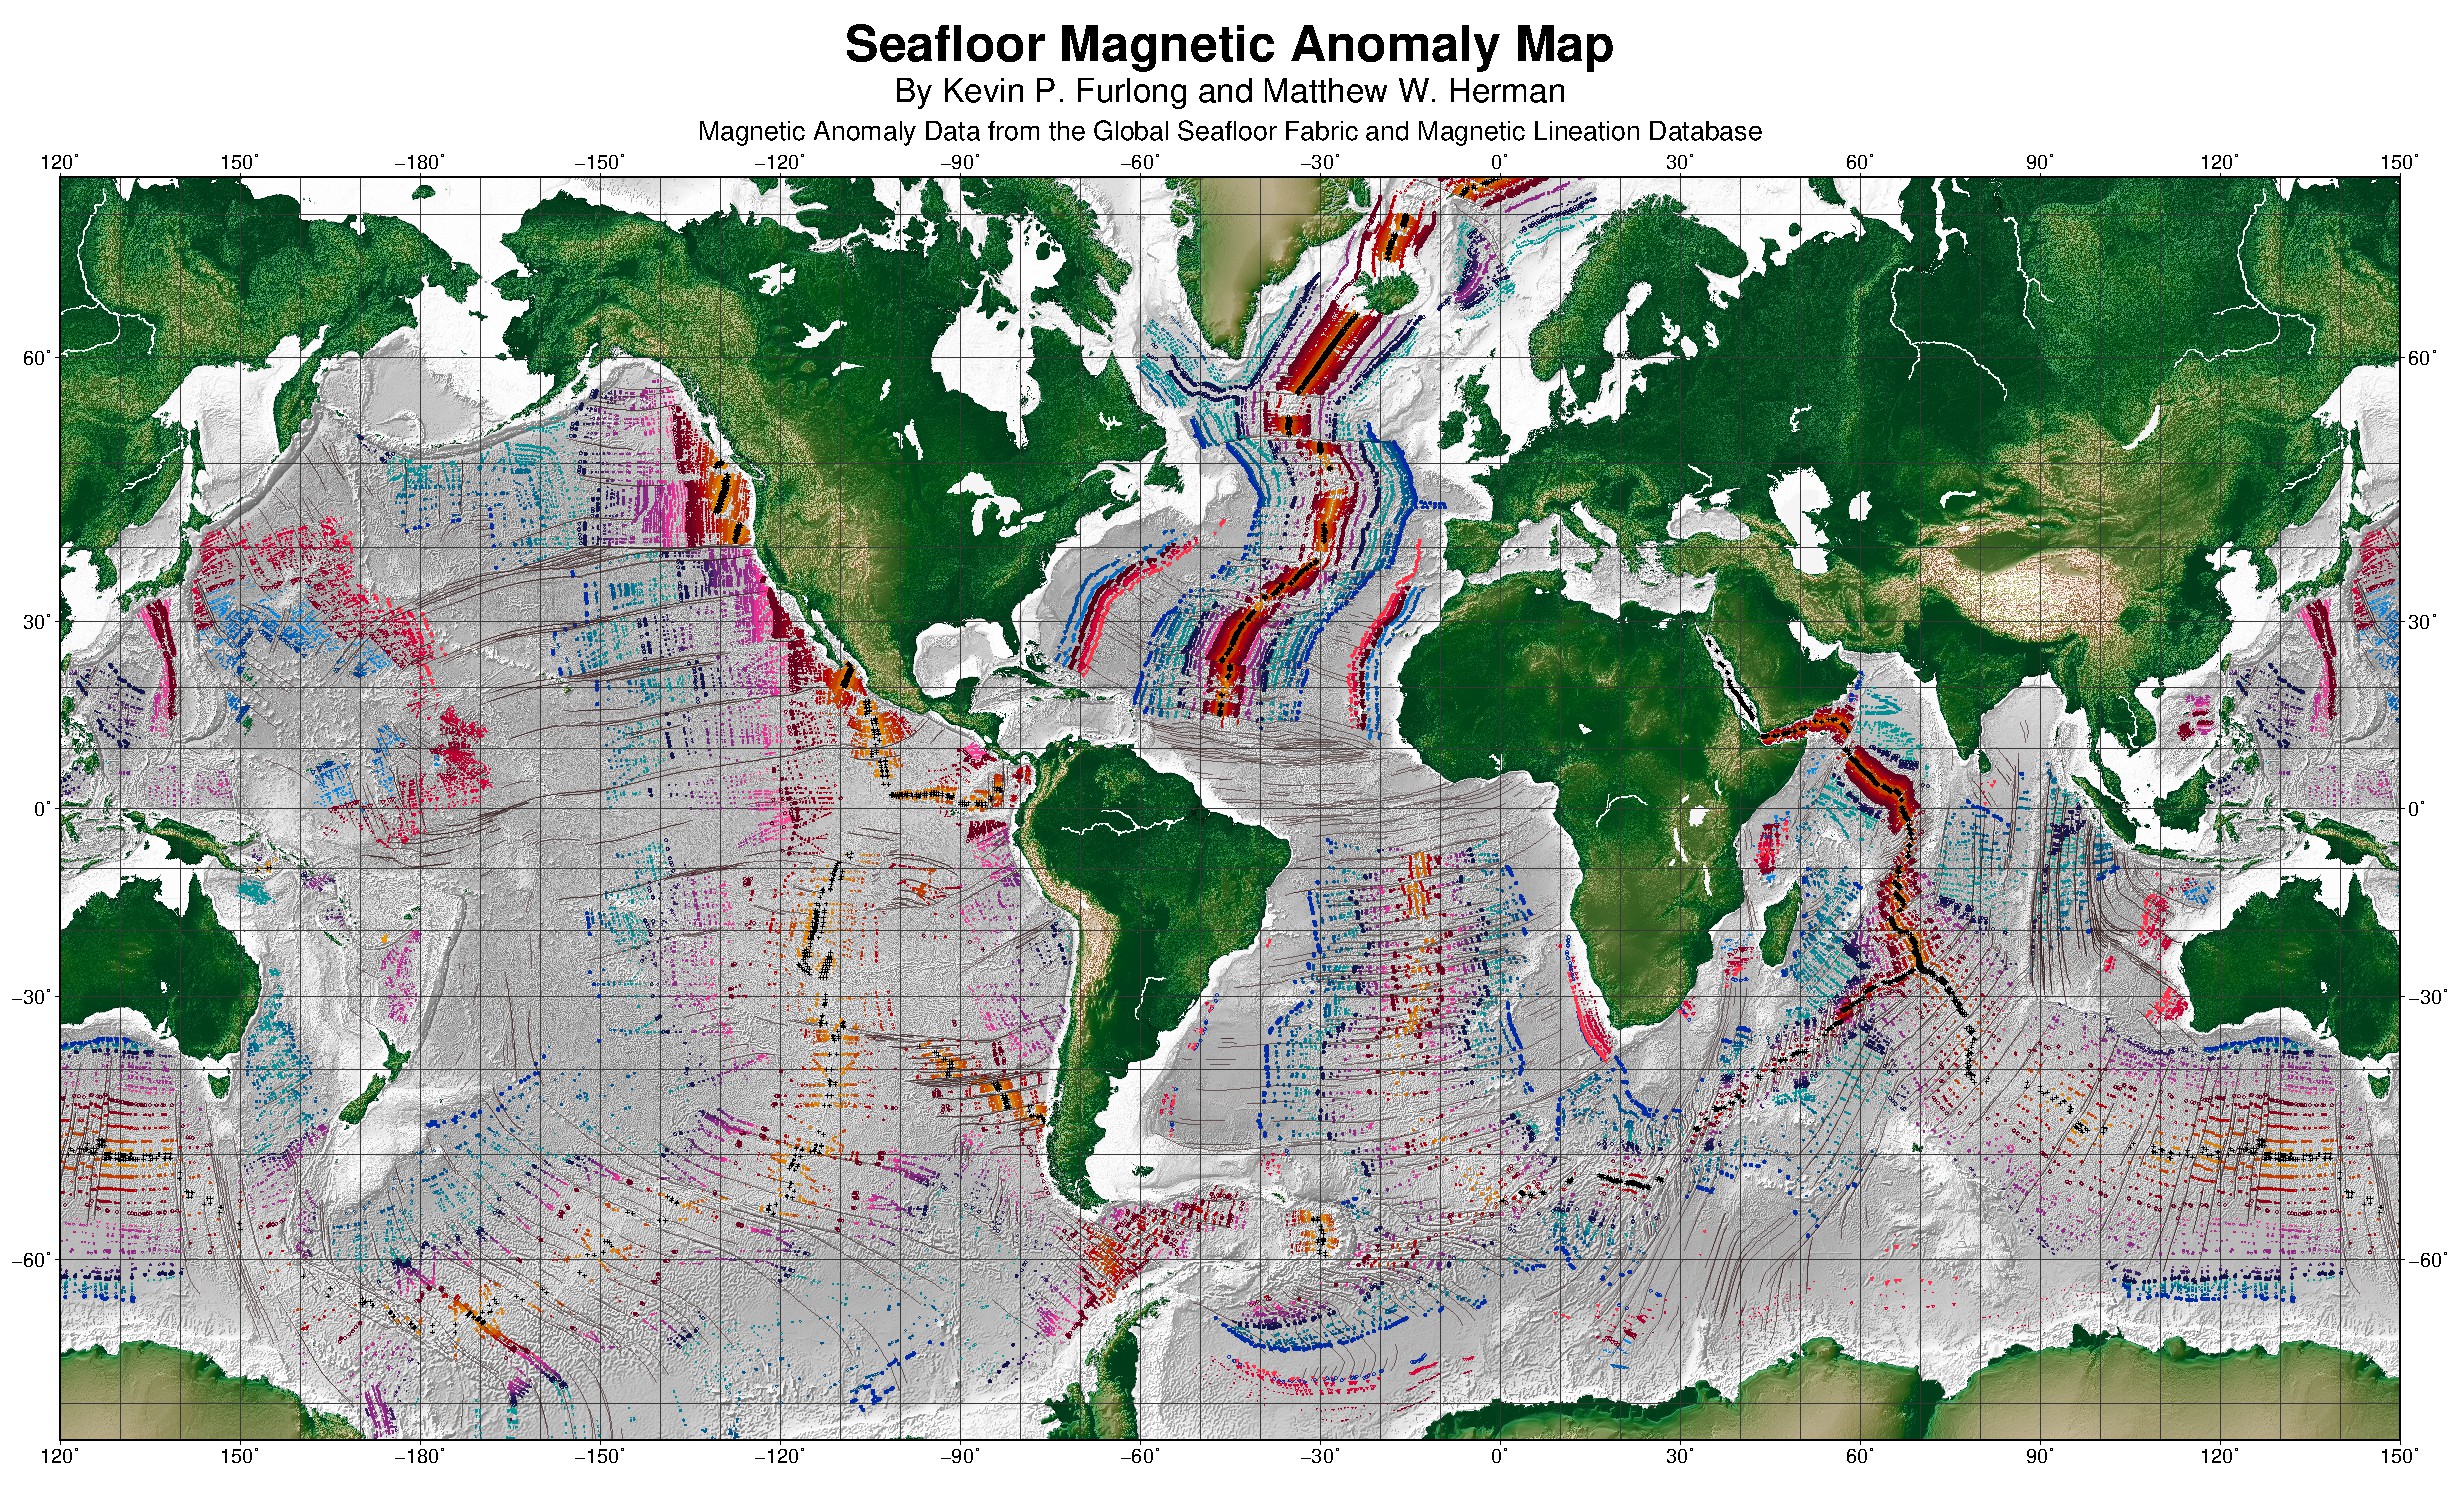
Magnetic anomalies and tectonic plate motions on a globe
One of the fundamental aspects of modern Earth Science is plate tectonics. This is the idea that the shallowest 100 km or so of the Earth is broken into rigid (undeforming) plates that move along the spherical surface of the Earth. The description of the plates as rigid plates is an excellent approximation most places on the Earth, except for a few mountain belts here and there. The first unambiguous evidence of plate tectonics came from observations of ocean floor magnetism in the 1960s. Scientists such as Vine and Matthews connected the patterns of Earth's magnetic field in the oceans to the spreading of the plates at mid-ocean ridges.
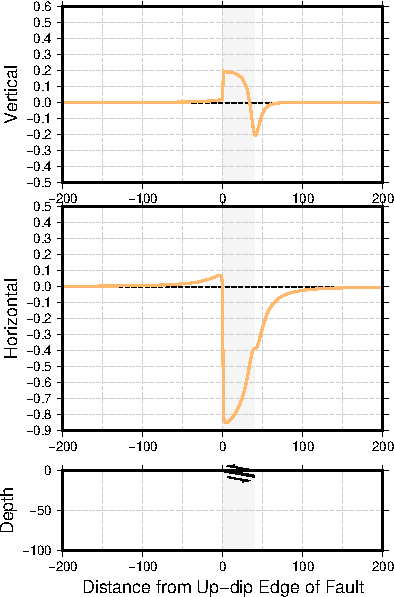
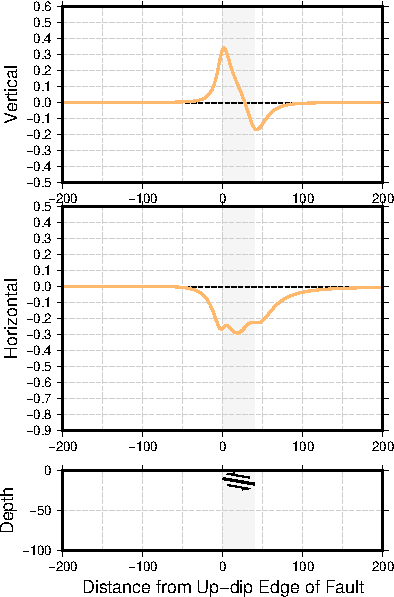
Surface motion from a fault
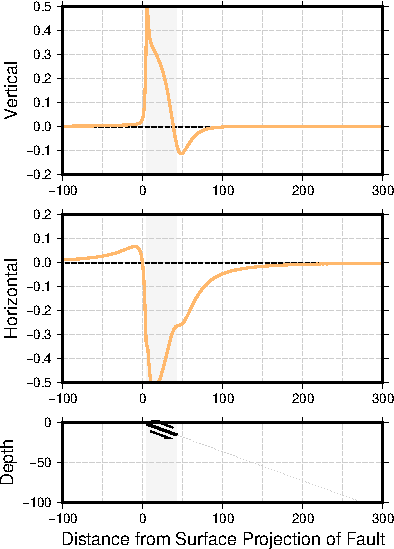
The patterns of surface motion observed soon after an earthquake help to constrain the fault that ruptured. These motions can be measured by GPS stations, satellite images, or careful surveying. The figures below show the predicted surface displacements produced by 1 meter of fault slip (roughly a magnitude 7.0 earthquake) on a thrust (compressional) fault for different fault orientations and fault depths. [Hover your mouse over the figures to see the images in motion.] The left panel shows the displacements when the top of the fault comes all the way to the surface. The center panel shows the displacements when the fault is buried 10 km below the surface. And the right panel shows what happens when the fault is at different depths.
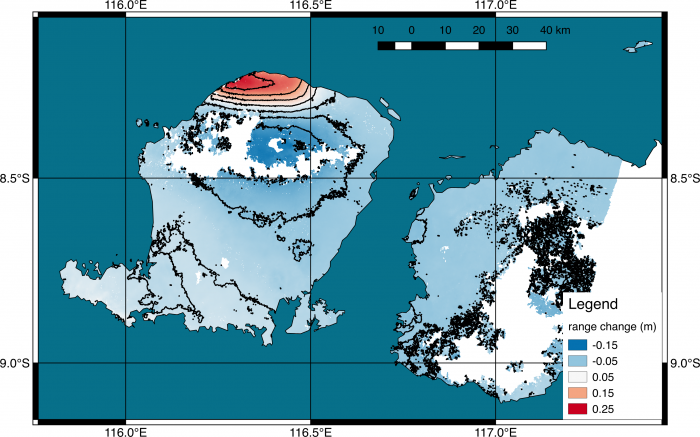
Okay, cool, I made some models of the way the surface should move because of an earthquake, but do these models have anything to do with reality? A recent example might help answer this question. Over the past couple weeks, there have been a few magnitude 6-7 earthquakes along the northern coast of Lombok, an island in Indonesia. Scientists at NASA use radar pictures of the ground taken by satellites to determine how much the ground moved, a technique called "Interferometric Synthetic Aperture Radar" or InSAR. With this kind of analysis, they can make the following image:
Subduction Earthquake Cycle Video
As an extension of our recent review paper on earthquake cycle processes at subduction zones (Govers et al., 2018), we created a video explaining the major features of our model. We explain the basic components of a subduction zone, the processes that directly cause earthquakes and tsunamis, and other processes that may obscure our ability to anticipate the eventual earthquake. We worked with a graphic designer to make the subduction zone elements visible and I provided the scientific voiceover for the video.
American School of the Hague
On 17 May 2018, I visited Mr. Brian Goltz' second grade classroom at the American School of the Hague to talk about the ongoing Hawaiian volcanic eruption and answer student questions. We had a great time learning how volcanoes work, what the dangers are from eruptions, and things people can do to be safe. Students asked me questions about the current eruption, past eruptions, hazards in their hometowns, and other topics in geology.